Shorting the S&P500 has proven to be a disastrous strategy over the long term, with a long position in the daily inverse S&P500 index having lost 92% of its value since 2009. It is no surprise therefore that short interest on US stocks has crashed to multiyear lows. However, there have been periods when short selling the market has been highly profitable and another such period may be upon us. From the 2000 market peak to the 2009 trough, short positions gained 125%, thanks to the combined impact of high yields on cash relative to the equity dividend yield, and falling valuations, which more than outweighed the impact of rising earnings and dividends.
SPY And QQQ Short Interest, % of Shares Outstanding (The Market Ear, JPMorgan)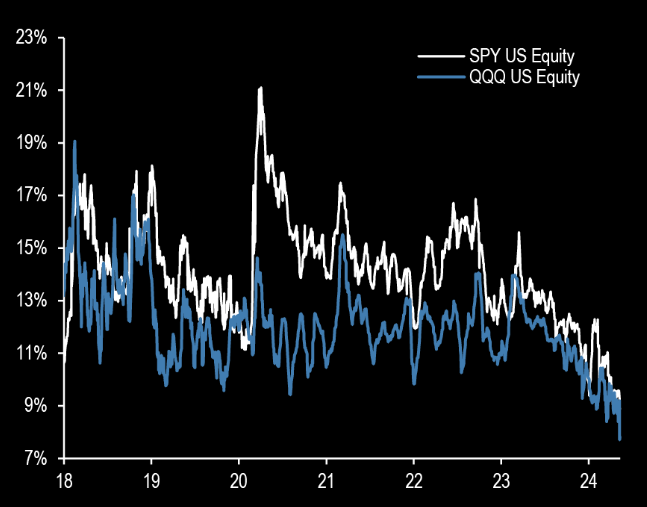
The conditions that gave rise to such strong returns for short sellers in 2000 are once again in place, with cash yielding far more than stocks and valuations at or near all-time highs. In addition, deteriorating macroeconomic conditions should result in weak earnings and dividend growth, reducing fundamental headwinds for short sellers. Although taking short bets may not be appropriate for most investors due to the theoretical risk of unlimited losses and the risk of margin calls, these risks can be mitigated with the use of daily inverse indices, such as the one tracked by the ProShares Short S&P500 (SH).
Getting Paid For Going Short
When investors sell the S&P500 short, they receive income in one form or another. When shorting through a brokerage account on margin, the brokerage typically pays interest on the cash deposited, less any brokerage fees and borrowing fees. Alternatively, the SH ETF engages in swap agreements and holds Treasury bills that generate interest, while also charging an expense fee. In both cases, the short seller must deduct from these cash proceeds the dividend yield that the S&P500 pays. In certain circumstances when interest rates are high and the equity dividend yield is low, shorting can be cash flow positive. This is the situation we currently find ourselves in.
Bloomberg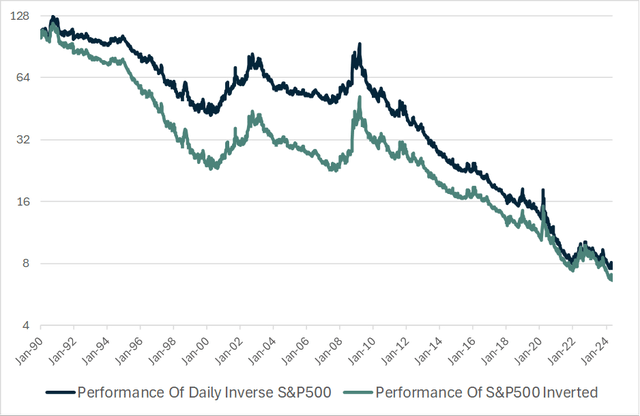
The chart above shows the performance of the daily inverse S&P500 index and the S&P500 price inverted, rebased to 100 in 1990, with the difference tracking the income differential between the rate on cash and the dividend yield. As you can see on the chart below, the inverse S&P500 index tends to outperform during periods when the Fed funds rate is above that of the dividend yield, and vice versa.
Bloomberg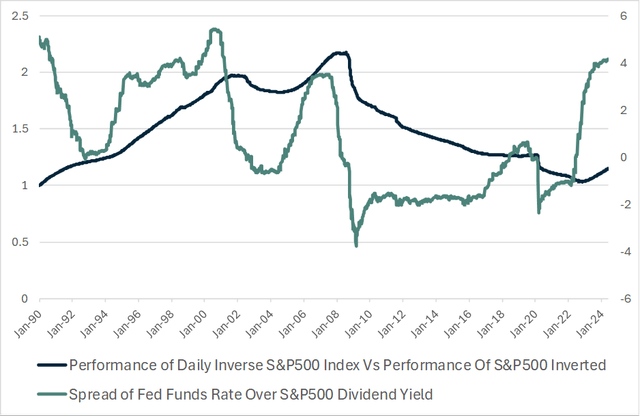
Betting On The Return Of An Equity Risk Premium
The fact that investors now get paid for shorting is certainly a bonus, but what is more important is what it says about the equity risk premium, which is the expected excess return on stocks, relative to cash and/or bonds owing to the former’s higher level of risk and volatility. Since 1990, the S&P500 has returned almost 9% a year more than cash, while this figure falls to 6% when measured since 1970. This reflects 5% average annual returns on cash and 11% on stocks, which can be broken down into a 6pp contribution from dividend growth, a 3pp contribution from the dividend yield, and a 2pp contribution from rising valuations (falling dividend yield).
If equity investors expect 6% excess returns on stocks relative to cash over the long term, with stocks now yielding around 4% less than cash, this will require 10% annual dividend growth in an economy that is trending at a 4% nominal growth rate. Assuming dividends grow by 4% in line with their long term trend of tracking nominal GDP growth, this would result in total excess returns on the S&P500 of around zero. Put another way, the dividend yield required for investors to generate 6% returns in excess of cash, assuming interest rates currently remain at levels of 5.5% and dividends grow at 4%, would be a staggeringly high 7.5%. Considering the yield is currently just 1.3%, this would require stock valuations to fall by 83%.
To be fair, interest rates are widely expected to fall, and I think it’s also fair to assume that the equity risk premium going forward will be lower than it has been in the past. However, even if the yield on cash were to fall back to 4% and the equity risk premium were to fall to just 3%, the dividend yield would still have to rise to 3% assuming 4% dividend growth, which would require a 57% price decline.
A rising equity risk premium fully explains why the S&P500 performed so poorly from 2000 to 2009. At the 2000 peak, the dividend yield was just 1.1%, while 10-year Treasury yields showed that cash was expected to yield around 6%. Over the next 9 years, dividends grew by an impressive 7% annually, yet a four percentage point rise in the dividend yield dragged stock valuations down by over 14% annually.
Dividend Growth Likely To Lag GDP Growth After Years Of Outperformance
It could be argued that dividends per share will manage to grow more strongly than my 4% assumption. The S&P500 dividend payout ratio sits at just 33%, which is low by historical standards as the largest companies have been using retained earnings to reinvest, rather than returning them to shareholders. A doubling of the payout ratio back to 1990s levels could conceivably allow dividends to grow at high single digit rates, justifying the current low dividend yield.
Bloomberg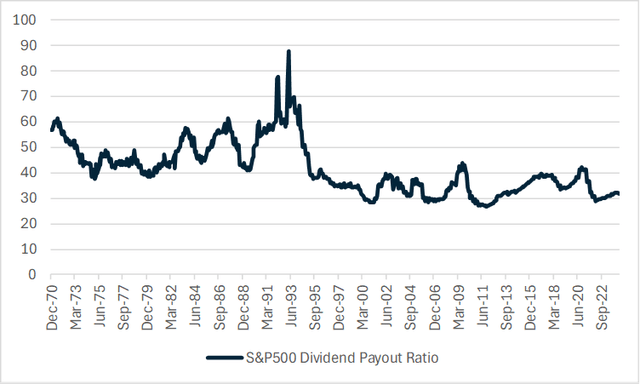
However, the low dividend payout ratio is not primarily the result of low dividend payments, but rather due to the extremely elevated corporate profit margins. The following chart shows dividends relative to earnings, earnings before interest and tax, sales, and book values. The low payout ratio reflects the rise in profit margins, which have primarily resulted from falling interest and tax expenses, which, as I argued here, have nowhere to go but up.
S&P500 Data (Bloomberg)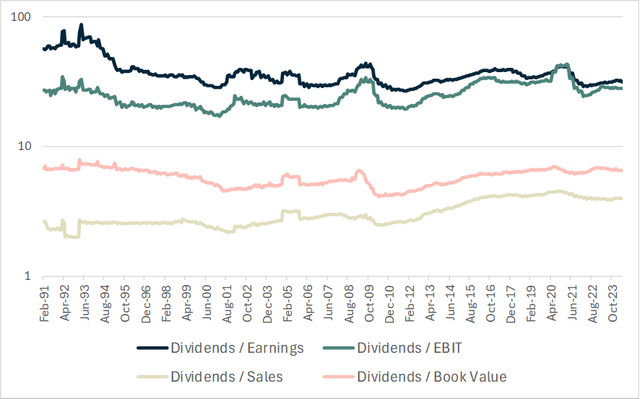
While I only have access to sales and pre-tax profits for the S&P500 going back to 1990, data for the economy as a while goes back to the 1940s and shows that economy-wide dividend payments are elevated, relative to earnings, and extremely elevated relative to pre-tax earnings, free cash flows, and GDP. It should be obvious to see that dividends cannot continue to outpace the growth of the economy indefinitely, and it seems more likely than not, that they will actually grow more slowly over the coming years, as profit margins themselves decline. amid the ongoing decline in US savings rates.
Economy Wide Data (BEA, Bloomberg)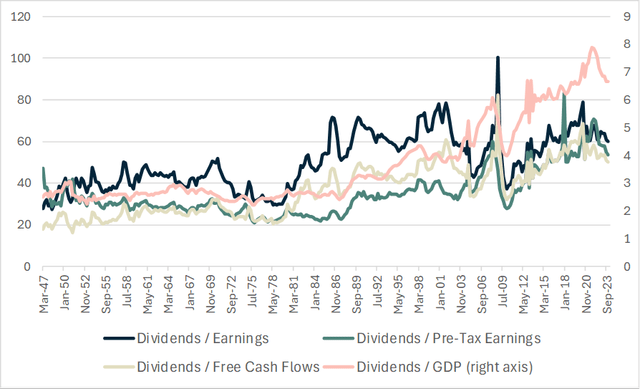
Another Factor Boosting Short Returns
I noted above that the returns on the daily inverse S&P500 index that the SH ETF tracks have tended to outperform what one would expect, based on the performance of the S&P500 alone during periods when cash has yielded more than stocks. While it is true that income differentials play a large role, there appears to be another factor at play that drives returns on the daily inverse S&P500 index. The chart below shows the year over year change in the performance of the daily inverse S&P500 index, relative to the S&P500 price inverted alongside the spread of the Fed funds rate over the dividend yield. What is noticeable is that while the two are closely correlated, they are not the same, showing that there is another factor driving returns on the inverted S&P500 index.
Bloomberg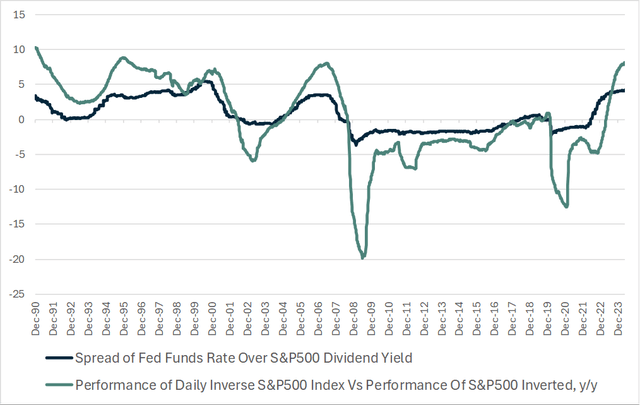
It turns out that the daily inverse S&P500 index underperforms what would be expected based on the performance of the S&P500 during periods when volatility is high, and outperforms when volatility is low. I suspect that this variability in performance reflects the impact of the daily rebalancing of the inverse index, although maybe readers can shed some more light on this phenomenon.
Bloomberg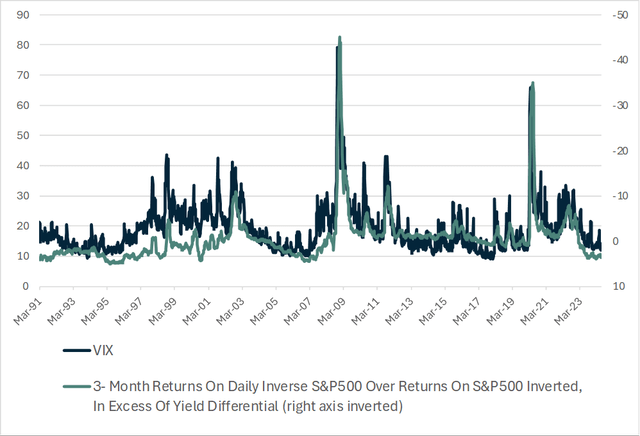
Summary
Shorting stocks is not for everyone, but for those willing to take bets against the market, this appears to be the most attractive set up since the 2000 bubble peak. While there is nothing to stop stocks from moving even higher from current extremes in the short term, short sellers now get paid handsomely to bet against it, and from a long term perspective, all it would take for sizeable returns is for the equity risk premium to rise from near zero to just a fraction of its historical average.
Read the full article here


