Today, bond yields rose and the stock market swooned, as the market was apparently spooked by some stronger-than-expected statistics coupled with the Atlanta Fed’s GDP Now forecast of 5% growth in the current quarter.
The fear is that the economy is “running hot” and that will prod the Fed to keep rates high (or higher) for longer, in order to lower the economy’s temperature – possibly triggering a recession at some point. My read of the data and other key indicators suggests nothing of the sort.
Chart #1
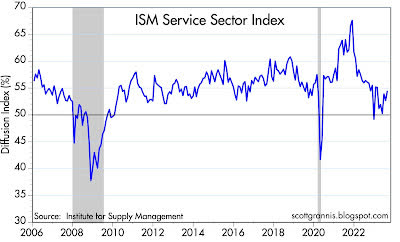
Chart #1 shows the ISM Service Sector Index. While it has ticked higher in recent months, it is still below the levels leading up to the Covid shutdowns, during which time the economy was experiencing relatively modest growth on the order of 2% per year. No boom here and no bust either.
Chart #2
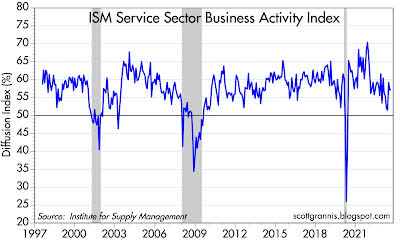
Chart #2 shows the Business Activity component of the overall index. Here too we see an uptick in recent months, but activity is still somewhat less strong than we saw in the latter half of the 2010s. If anything, I’d say this looks like “steady as she goes.”
Chart #3
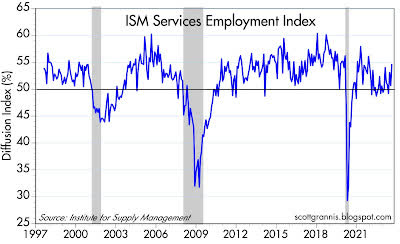
Chart #3 shows the employment component of the Services index. Same story as the others. A modest increase in the number of firms reporting increased hiring activity, but nothing to suggest a boom that needs to be snuffed out.
Chart #4
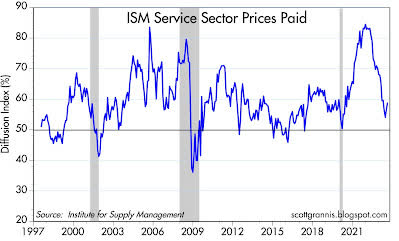
Chart #4 shows a modest increase in the number of firms reporting paying higher prices. This comes after a gigantic decline over the previous year, which corresponded closely with a similar decline in overall inflation.
Does the recent uptick foreshadow a return of higher inflation, or is it just a wiggle such as we have seen on and off over the years?
I’d have to see rising prices showing in other areas to believe this is of concern. Instead, I see most commodity prices flat to down, and housing prices sharply lower than a year ago.
(And of course it bears repeating that the ex-shelter version of the CPI has increased only 0.8% in the past year.) The major exception is rising oil prices which are likely being driven by ongoing problems with Russia’s Ukraine-related sanctions. I also see a stronger dollar which is the very antithesis of inflation.
Chart #5
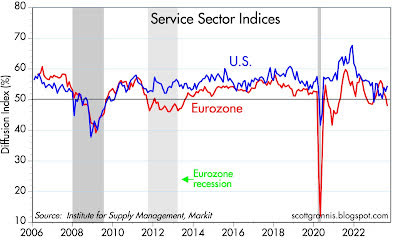
Chart #5 compares the U.S. service sector index (same one as shown in Chart #1 above) with a similar index measuring the health of the service sector in the Eurozone. The Eurozone is hurting, that’s for sure, and so is China.
It’s tough to see how widespread weakness overseas is going to foster inflationary growth conditions in the U.S. In addition, a strong dollar – driven by rising rates – actually reinforces disinflationary pressures here, since it makes imports cheaper and keeps downward pressure on export prices.
If the Fed raises rates yet again, that would likely drive the dollar still higher and that in turn would begin to create destabilizing forces overseas.
Chart #6
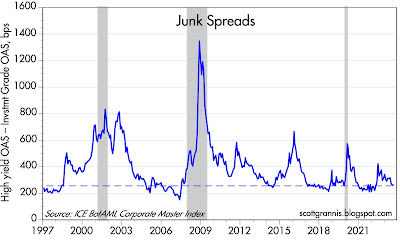
Chart #6 shows the spread between the yield on investment grade corporate bonds and their “junk” rated counterparts. This spread is saying the prospects for the U.S. economy are quite favorable (since the spread is unusually low), because investors demand only a relatively small premium to take on the additional credit risk of junk bonds.
This is notable especially now, coming on the heels of an impressive increase in corporate debt issuance. Despite increased debt supply, corporate bond yields have not increased in any meaningful fashion. That further suggests that there is no shortage of liquidity in the bond market, and that all but rules out a near-term recession.
I’ll repeat once more that the unique characteristic of the Fed’s current tightening episode is the continued abundance of bank reserves, which currently total over $3 trillion.
All other tightening episodes saw a deliberate contraction in bank reserves (banks actually had to borrow reserves to meet their collateral requirements), and that in turn led to a scarcity of liquidity in the banking system.
With lots of liquidity the market is capable of adjusting to almost any kind of disruption. That wasn’t the case in prior tightening episodes. Interest rates may be high but there is no shortage of money.
Chart #7
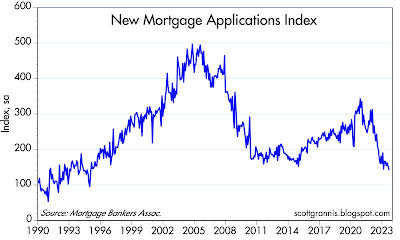
Chart #8
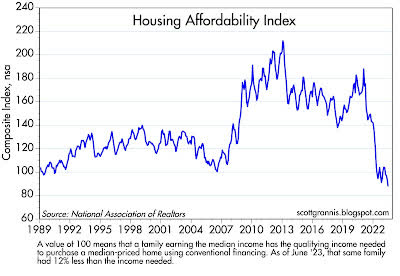
Chart #7 shows an index of new mortgage applications, which are down over 50% since early 2021, and down about 70% from the days of the housing market boom in the mid-2000s.
Chart #8 shows an index of housing affordability, which has reached a 33-year low. Higher interest rates have had a huge impact on the housing market, driving resale and refi activity sharply lower, all while making housing unaffordable to legions of households. If any sector of the economy is at risk of a bust, it’s housing.
Housing is also suffering from an effective liquidity shortage. Homes for sale are at very low levels because 1) sellers don’t want to give up their 3% mortgages and 2) buyers don’t want to take on a 7% mortgage.
With very low turnover, no one can be sure that current home prices are indicative of underlying value. Moreover, desperate buyers are likely to pay more than they can afford and are thus vulnerable to a recession or any downturn in prices. This is probably the worst time in many decades
Original Post
Editor’s Note: The summary bullets for this article were chosen by Seeking Alpha editors.
Read the full article here


