As the new round of monetary policy decision is approaching, it is crucial to understand the rationale surrounding inflation dynamics in order to project future scenario probabilities for the S&P500 (SPX). The FED has been decoupling inflation into three main components that, while evaluated separately, are interwound in generating total inflation.
The first element is called ‘goods inflation’. It refers to price increases in general goods due to the consumption shift from services to goods during the pandemic and afterward, also related to the abundant supply chain constraints. The second bucket, the ‘housing inflation’, also kicked in with the strong demand conversion to larger places in potentially less dense regions with lock-in measures and house improvement activities related to remote working. Both these components reinforced FED’s failed perspective that inflation was transitory as the dynamics were directly related to the pandemic.
And then there is the third point: the ‘labor market inflation’!
The relationship between unemployment and inflation is well documented in the economics literature, a famous concept called the Phillips Curve. From a policy execution standpoint, as Fed Funds were raised, the expectation was that the higher cost of money would weigh on consumers and firms. On consumers, it changes what in economics is called the Marginal Propensity to Consume. With higher rates, individuals tend to allocate more of their personal income to savings or avoid consumption that embeds debt. On firms, higher rates may impose a harsher environment for Capex, for example. In both cases, the expectation is that a ‘slower’ economy with lower inflation imposes a toll on the labor market, as new hirings would weaken and lay-offs ramp up. The issue in nowadays markets is that as the interest forced inflation downwards, labor market resilience continued to surprise pointing to a risk in the continuation of inflation path towards the 2% target.
The FED acknowledges, by the way, that both goods and housing inflation moderated. Understanding the labor market is then the key to conveying scenarios for the economy and the market.
Did Something Change in the Labor Market?
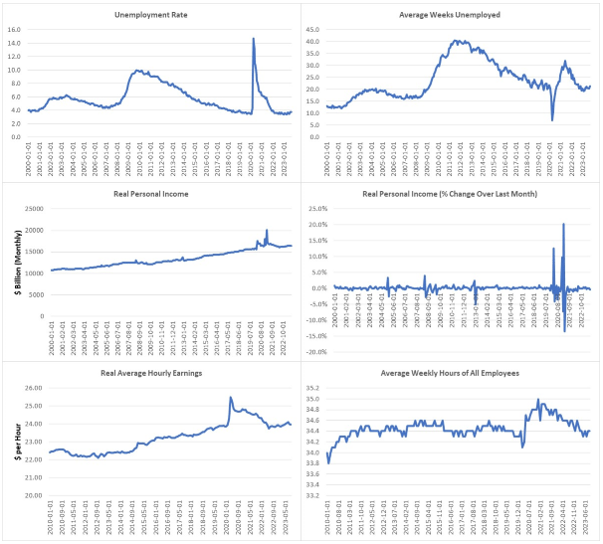
To understand labor dynamics, Figure 1 depicts some of the most relevant statistics on the topic.
Figure 1: Labor Market Indicators (St. Louis Fred)
There are two remarkable features related to the current state of labor market: the fact that the changes occurred with the pandemic reverted to previous levels and monetary tightening still didn’t impact the labor environment. The Unemployment Rate (St. Louis Fred, Series: UNRATE, Unemployment Rate, Percent, Monthly, Seasonally Adjusted) is currently at historical lows, at 3.8% in Sep/2023, at the same level as December/2019 at 3.6%. Such sort of level was only recorded in Q3/2000 in the last 50 years. Before that, Q3/1969 was the last time. Similarly, the average time spent by individuals to get a new job (St. Louis Fred, Series: UEMPMEAN, Average Weeks Unemployed, Weeks, Monthly, Seasonally Adjusted) reverted from a recent peak of 32 weeks in Jun/2022 to the pre-pandemic level of 21.5 weeks in Sep/2023. Current levels are on a sort of upper band in a long-term perspective down from a historical peak in 2011.
Work compensation data also depicts a similar trend. Real Personal Income (St. Louis Fred, Series: PI, Personal Income, Billions of Dollars, Monthly, Seasonally Adjusted Annual Rate – deflated by the author: St. Louis Fred, Series: CPIAUCSL, Consumer Price Index for All Urban Consumers: All Items in U.S. City Average, Index 1982-1984=100, Monthly, Seasonally Adjusted), its percentage change over the previous month, and real Average Hourly Earnings of Workers (St. Louis Fred, Series: CES0500000003, Average Hourly Earnings of All Employees, Total Private, Dollars per Hour, Monthly, Seasonally Adjusted – same deflation applied by the author) all reverted to 2019 level, including the drift observed in the historical series.
At last, the Average Number of Hours Worked (St. Louis Fred, Series: AWHAETP, Average Weekly Hours of All Employees, Total Private, Hours, Monthly, Seasonally Adjusted), an important leading indicator to employment, also normalized indicating a lower appetite for new hirings in the future.
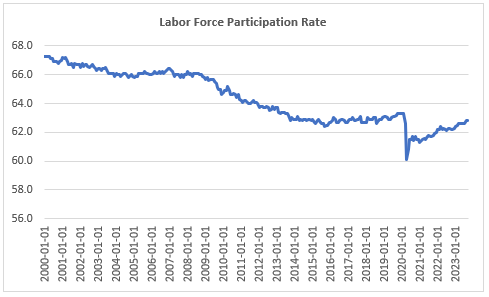
The answer to the question proposed in this session is not easy, though. One important element that seems to be playing a role in the apparent break in the theoretical link between inflation reduction and unemployment is the participation rate. Figure 2 illustrates this series.
Figure 2: Labor Force Participation Rate (St. Louis Fred)
From a long-term perspective, the Labor Participation Rate (St. Louis Fred, Series: CIVPART, Labor Force Participation Rate, Percent, Monthly, Seasonally Adjusted) recorded a constant increase from the 60’s to the end of the XX century, as a result of remarkable social changes, including feminine employment growth. On the other hand, since the year 2000, participation has steadily declined due to the aging population, technology, and flexible ‘working’ schemes such as Uber. On the opposite hand from the numbers verified for the labor indicators in Figure 1, labor participation is taking a slow recovery to pre-pandemic levels. In Sep/2023, the participation rate is at 62.8% – still 0.5 p.p. below the level observed in Dec/2019!
Remember that someone is considered unemployed only if he or she is actively looking for a job. As a result, there is a sample difference in the labor indicators before and after the pandemic that may be impairing the ability to understand labor market dynamics entirely.
Why Is Taking So Long for Participation to Respond?
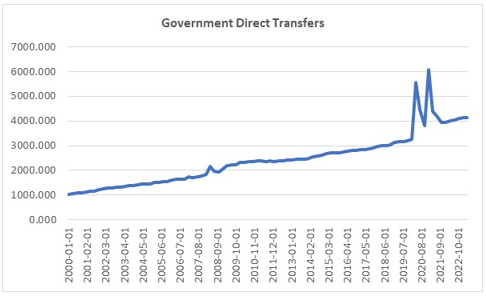
Among several possible explanations for labor participation recovering slower than other labor indicators, the government’s direct transfers to individuals are a central piece. As shown in Figure 3, Government Current Transfer Payments (St. Louis Fred, Series: A084RC1Q027SBEA, Government current transfer payments, Billions of Dollars, Quarterly, Seasonally Adjusted Annual Rate) is 27.3% higher than before the impact of Covid. Moreover, during this period, the volume of transfers spiked resulting in an unprecedented strength in the balance sheet of families in the US.
Figure 3: Government Direct Transfers (St. Louis Fred)
In fact, the evaluation of the participation rate and the direct transfers show statistical relevance. Using a Vector Auto-regression Model, it is confirmed the inverse relationship between the variables, meaning that increases in direct transfers induce a lower labor participation rate.
Key Takeaways: Labor and Financial Market Prospects
The labor environment is a key factor in the path of monetary policy. Considering the breakdown the FED is using for inflation dynamics, this is the source of greater uncertainty regarding the level of Fed Funds to be set in upcoming FOMC meetings.
Up to now, the increase in the interest rate has not impacted unemployment since the participation rate declined sharply and is slowly recovering prior levels. As this kind of ‘hidden unemployment’ offsets, it can be expected that the unemployment rate become more sensitive to the current Fed Funds level in the near future than it was in the tightening cycle so far. With this in mind, it is expected that the FOMC might be cautious in engaging in unannounced rounds of monetary contraction and that the hiking cycle is at or near the end.
Going forward, the soft-landing scenario in which inflation may be contained without relevant damage to production and employment seems viable. Among other points, it is also dependent on exogenous factors, such as oil. The main risk, on the boundaries of this article, is related to the lack of coordination between monetary contraction and fiscal expansion. In the case that consumption is not impacted by higher rates, due to the income transfers, for example, inflation may become more resilient, and further monetary effort may be needed to close the inflationary gap to the 2% target.
For financial markets, this point is crucial. In the potential soft-landing scenario, a ‘consensus’ around ‘final rates’ may drive the stabilization of bond markets, especially in higher duration. In that situation, equities would also benefit from lower uncertainty and strong earnings.
Read the full article here


