
A lot of investors are worried about buying anything right now, and that’s understandable. Let’s consider recession risk.
NY Fed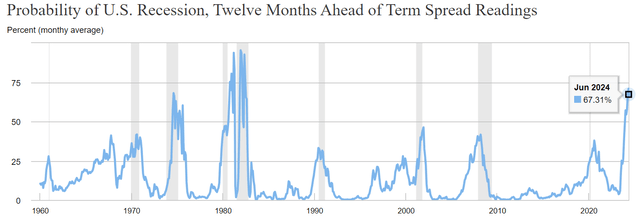
The New York Fed estimates a 67% chance of a recession within the next year, the highest risk in 43 years.
What could cause this recession? The same thing that causes most of them. In an economy of 70% powered by consumer spending, people are starting to get squeezed.
Daily Shot 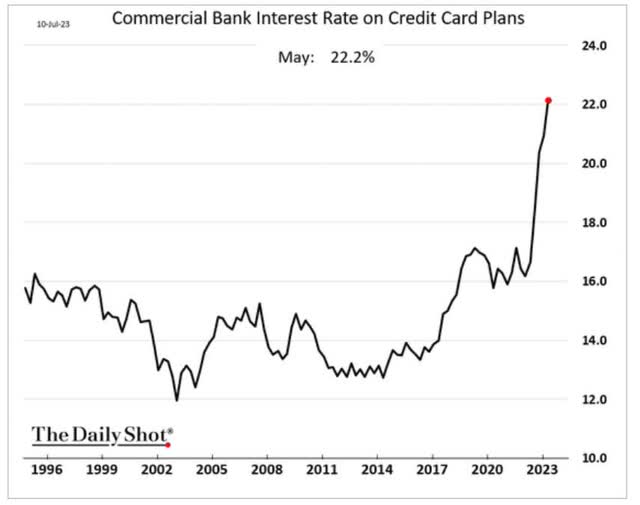
Credit card rates just hit a new record high, higher than even during the 1980s.
According to Experian, the average credit card balance for families in the U.S. is $6,270. This is the balance that is carried over from month to month and is subject to interest charges.
The range is from $5,408 in Kentucky to $9,408 in Connecticut.
This means the average U.S. family is now paying $115 per month in interest.
And the Fed hasn’t even stopped hiking yet!
Daily Shot 
The Fed consensus is that two more 25 basis point hikes are coming. And the Fed then plans to keep rates that high until at least May 2024.
Banks are going to keep raising credit rates as long as the Fed is holding rates higher for longer and credit card default rates remain moderate.
And the Fed might end up going a lot higher than 5.5%. Minneapolis Fed President Neel Kashkari was the most dovish Fed President before the Pandemic.
Now he’s become a fire-breathing inflation-battling hawk calling for hikes every meeting this year and then holding rates that high for months.
So what does this mean for the economy? Recession, the debate is how bad.
And what does that mean for stocks?
S&P Bear Market Bottom Scenarios (Recession Begins April 2024, Market Bottom July 2024)
| Earnings Decline | S&P Trough Earnings | Historical Trough PE Of 14 (13 to 15 range) | Decline From Current Level | Peak Decline From Record Highs |
| 0% (Mildest recession in history, unprecedented lack of earnings decline) | 260 | 3645 | 18.7% | -24.4% |
| 5%(blue-chip consensus) | 247 | 3463 | 22.8% | -28.1% |
| 10% | 234 | 3281 | 26.8% | -31.9% |
| 13% (Average since WWII) | 227 | 3171 | 29.3% | -34.2% |
| 15% | 221 | 3098 | 30.9% | -35.7% |
| 20% (Morgan Stanley) | 208 | 2916 | 35.0% | -39.5% |
(Source: Bloomberg, FactSet, DK S&P 500 Valuation Table.)
This table already accounts for the fact that in mid-2024, the market will be looking forward a year to 2025.
These are some scary numbers for many investors. And guess what? There is no path dependency.
Take the 2024 EPS forecast and the 2025 EPS forecast. Apply any recession decline you want (or none at all) and the historical recessionary bear market trough P/E range, and these are the numbers you get.
S&P Bear Market Bottom Scenarios BULLISH CASE (Recession Begins April 2024, Market Bottom July 2024)
| Earnings Decline | S&P Trough Earnings | Historical Trough P/E Of 15 (13 to 15 range) | Decline From Current Level | Peak Decline From Record Highs |
| 0% (unprecedented lack of EPS decline in recession) | 260 | 3906 | 12.9% | -19.0% |
| 5% (blue-chip consensus) | 247 | 3710 | 17.3% | -23.0% |
| 10% (Fed banking loan data, Goldman Sachs) | 234 | 3515 | 21.6% | -27.1% |
| 13% (average since WWII) | 227 | 3398 | 24.2% | -29.5% |
| 15% (Bank of America) | 221 | 3320 | 26.0% | -31.1% |
| 20% (Morgan Stanley, who doesn’t even expect a recession!) | 208 | 3124 | 30.3% | -35.2% |
(Source: Bloomberg, FactSet, DK S&P 500 Valuation Table.)
In 1946, the S&P (SP500) fell 28%, just like the market did in 2022.
It then spent 18 months grinding higher, almost back to record highs. Investors were thrilled. “It’s over! All clear!”
And then, the recession hit, and stocks fell 30% back to new lows. Not much lower lows, but the shock was worse because investors were lulled into complacency.
My goal isn’t to scare you out of stocks.
Economic Timing Doesn’t Work
Charlie Bilello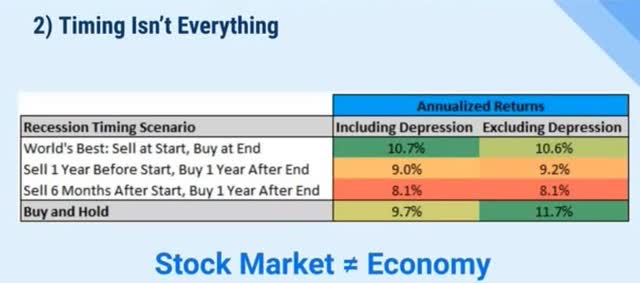
Market Timing Doesn’t Work
JPMorgan Asset Management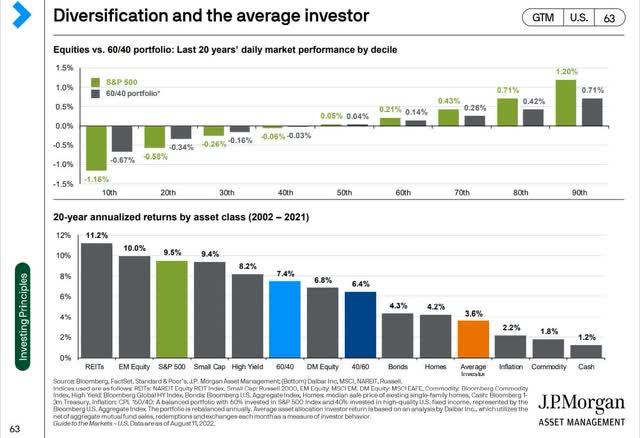
Market Timing Doesn’t Work In Other Countries
Vanguard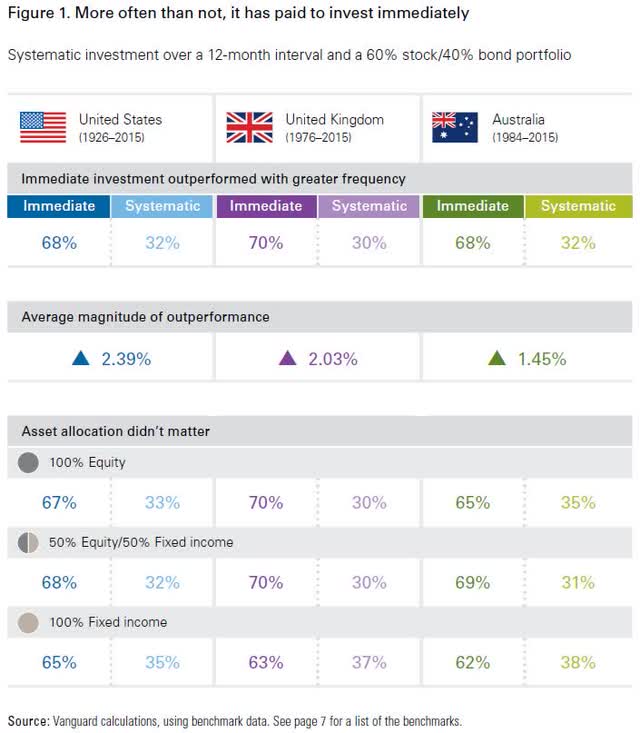
Being invested in the world’s best companies is the right call. So why tell you a recession is coming if I’m telling you not to change your reasonable and prudent portfolio plan? Because I want to make you a stock market genius by teaching you how not to be an idiot.
What is an idiotic decision today?
Classic Signs Of Market Idiocy
YCharts FAST Graphs, FactSet
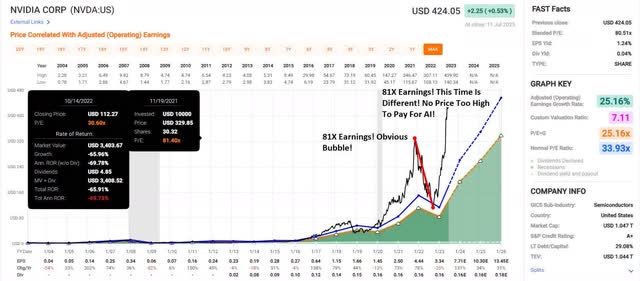
Do you know the amazing returns you can realistically expect to earn by paying 81X earnings for Nvidia Corporation (NVDA), a 25% growth company valued by the market at 34X earnings for 20 years? 8% through January 2026.
That’s a breathtaking 3% annual return! In exchange for taking the risk of a correction.
Portfolio Visualizer Premium 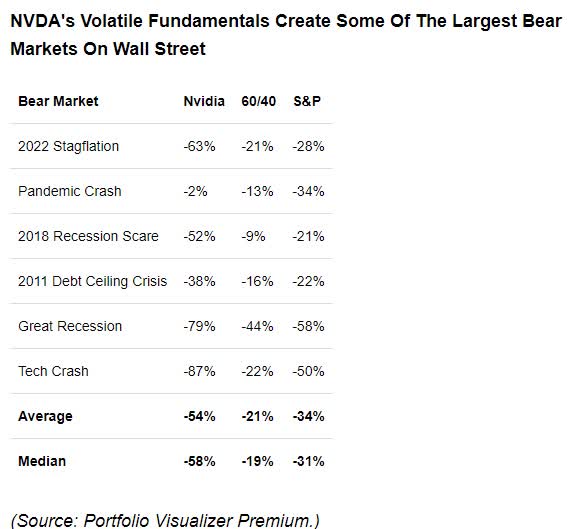
NVDA doesn’t have pullbacks or corrections. It has gut-wrenching, jaw-dropping declines.
A cyclical hyper-volatile chip maker trading at 81X earnings, a 138% premium? Ahead of a recession? Sure, that makes sense!
Ycharts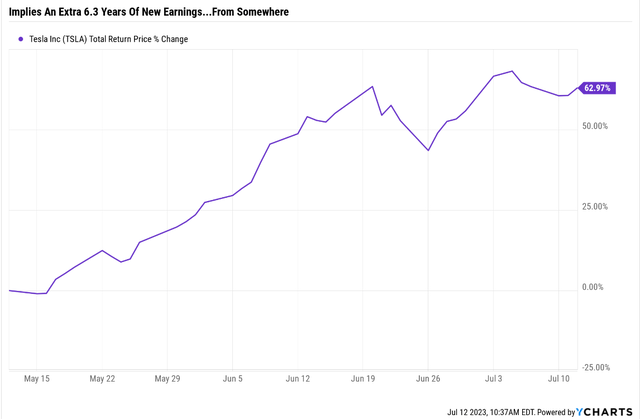
According to Ben Carlson of Ritholtz Wealth Management, in order for this 2-month rally in Tesla to be justified by fundamentals, the company would have to discuss the equivalent of an extra 6.3 YEARS worth of profits.
So General Motors (GM) and Ford Motor Company (F) say they will move to the Tesla (TSLA) Supercharger standard. Does that mean that Tesla will actually make a lot of money from that? 6.3 years’ worth of money? Call me skeptical.
There are two times in a man’s life when he should not speculate. When he can’t afford it, and when he can.” – Mark Twain.
Verizon: The Anti-Stupid Choice In A Very Stupid Market
Ycharts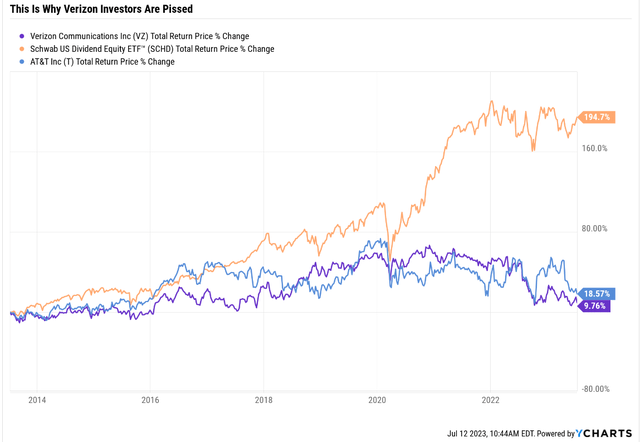
This is why Verizon Communications Inc. (NYSE:VZ) is a battleground stock on Seeking Alpha.
Adjusted for inflation, investors have lost money for a decade, even with the generous dividend. They’ve also lost to AT&T, the dumpster fire of a company former dividend aristocrat.
But do you know what the difference is between a value trap and a potentially once-in-a-quarter-century opportunity? FUNDAMENTALS!
Verizon’s fundamentals over the last ten years are:
- Annual sales growth: 0.1%
- Annual dividend growth: 2.4%
- Annual earnings growth: 3.8%.
Is Verizon a fast-growing company? Nope. Its growth rate is slightly better than inflation, and its dividend keeps up with inflation.
But is a growing company a value trap? That depends on what value you paid!
FAST Graphs, FactSet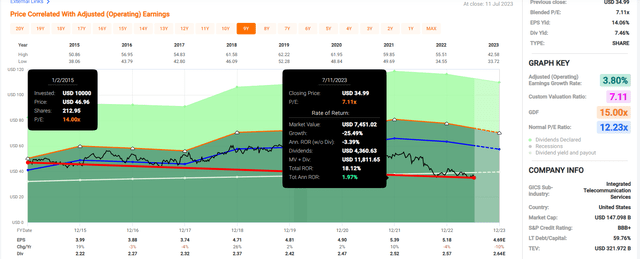
Verizon, ten years ago, was slightly overvalued at 14X earnings. But it has grown steadily, and when the price falls and earnings growths stalls, this happens.
Ycharts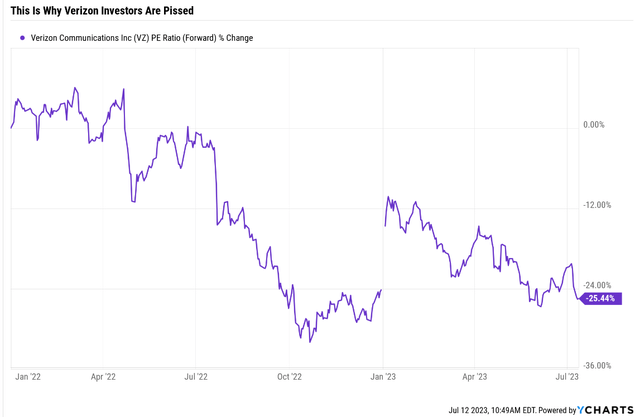
Verizon’s P/E ratio is down 25% over the last decade.
OK, but maybe Verizon’s growth outlook has collapsed? Nope, it’s 2.8%, slightly better than the 2.1% growth rate of the last 20 years.
Ok, but maybe Verizon is getting crushed by soaring interest rates? Sure, that’s a concern that some analysts and rating agencies have pointed out.
But take a look at Verizon’s balance sheet.
FactSet Research Terminal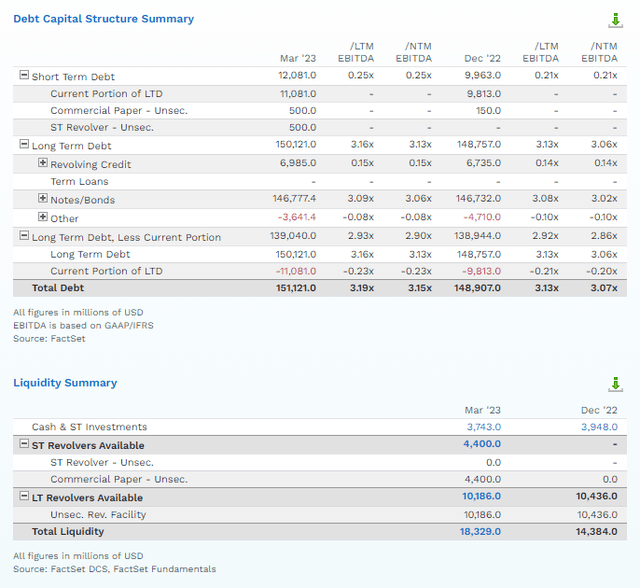
3.5X debt/EBITDA is what rating agencies consider safe for telecoms.
Verizon has high debt but stable cash flow.
FactSet Research Terminal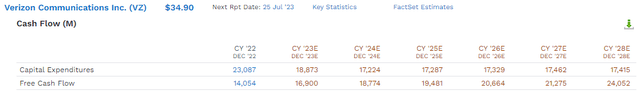
Verizon’s free cash flow is expected to grow steadily at a pretty impressive clip through 2028.
How can any business growing free cash flow by almost double-digits be a value trap? How about a steadily growing company with a healthy and safe balance sheet?
FactSet Research Terminal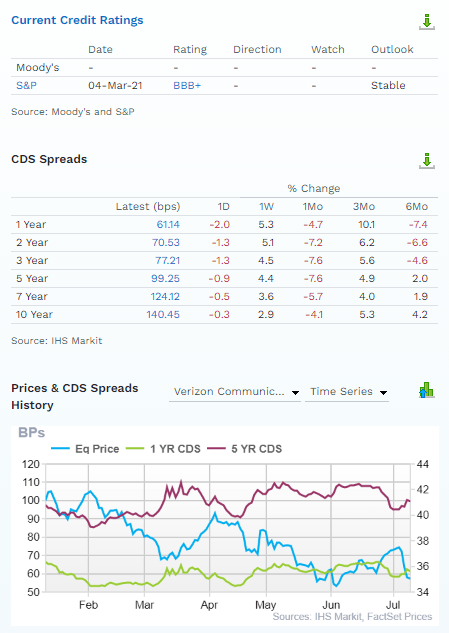
This is a BBB+ stable rated company, with S&P estimating a 5% risk of bankruptcy within 30 years.
The bond market estimates the risk at 4.2%, and that risk has been relatively stable even as interest rates have soared and the stock price has crashed.
Bond investors aren’t worried if rating agencies aren’t worried, and 28 analysts expect steady if not exactly thrilling, growth. There is one more question to answer before we debunk the “Verizon value trap” myth.
Verizon is all about the dividend and always has been.
So, a 7.5% yield might be attractive, even very attractive. But only if it’s safe and likely to keep growing steadily over time.
So, now that we’ve confirmed that Verizon’s balance sheet isn’t dangerous, it’s time to look at the payout ratio.
- 2023 FCF payout ratio: 67% vs. 70% safe according to rating agencies
- 2024: 58%
- 2025: 57%
- 2026: 56%
- 2027: 56%
- 2028: 51%.
Nope, the dividend isn’t dangerous. It’s right below our borderline for very safe.
- DK 80% safety score
- 1% average recession dividend cut risk
- 2.1% severe recession dividend cut risk.
OK, now that we’ve debunked the myth that Verizon is a value and yield trap, I’m pounding the table about this blue chip today.
If Verizon is all about safe and slowly but steadily growing yield, let’s take a look at the yield.
Highest Yield In 25 Years!
Yield Chart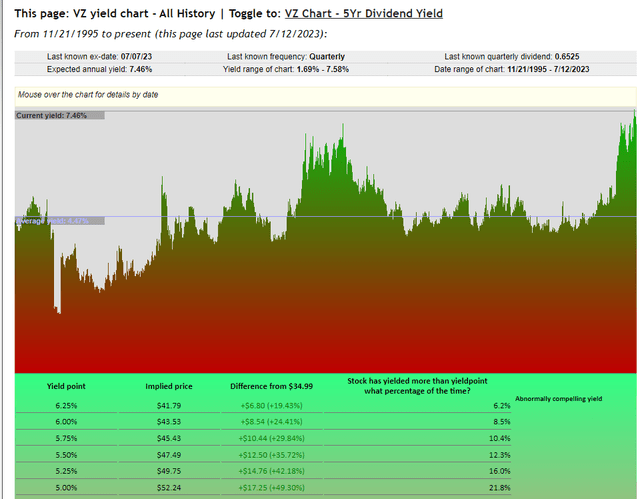
Verizon’s yield has only been at 7+% less than 1% of the time in the last 25 years.
It’s the highest yield for Verizon in a quarter century. In fact, this is the highest yield in Verizon’s history.
Ycharts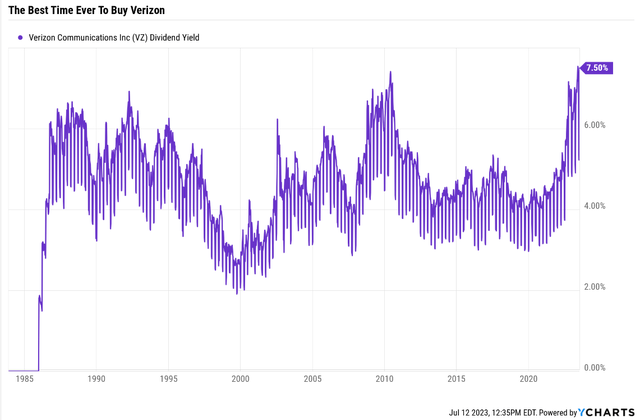
Verizon’s yield wasn’t as attractive during the Pandemic, the Great Recession, or even the 1987 Black Tuesday crash when stocks fell 20% in a day.
Outstanding Value
- fair value: $57.18
- current price: $34.84
- discount: 39%
- quality: 77% medium-risk 10/13 blue-chip
- DK rating: Potential strong buy, bordering on very strong buy
- Yield: 7.5%
- long-term growth consensus: 2.8%
- long-term total return potential: 10.3% CAGR vs. 10.2% S&P.
Do you want to match the market’s returns while earning a relatively safe 7.5% yield?
How about earnings medium-term returns like these?
Verizon 2025 Consensus Total Return Potential
FactSet Research 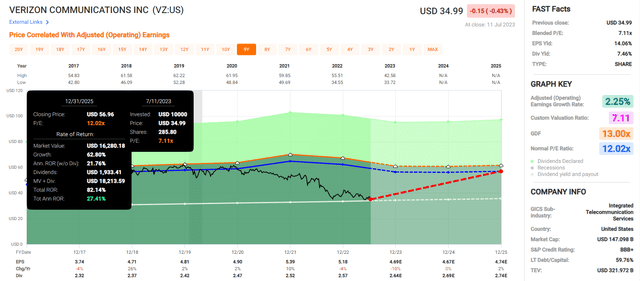
Verizon is trading at 7X earnings, priced for -3% growth. It’s growing at 3%.
It’s so undervalued, so that as long as it grows at 0% over time, the dividend should always be safe, and you literally won’t be able to lose money. As long as you avoid selling it at the wrong time, out of disgust, or panic and sell in a correction.
Verizon’s Best Bull Market Rallies Off Bear Market Lows
| Time Frame (Years) | Annual Returns | Total Returns |
| 1 | 77% (Medallion Fund, Renaissance Tech returns) | 77% |
| 3 | 35% (Joel Greenblatt-like returns) | 148% |
| 5 | 25% (Joel Greenblatt-like returns) | 208% |
| 7 | 22% (Buffett-like returns) | 293% |
| 10 | 17% (Ben Graham-like returns) | 401% |
| 15 | 17% (Ben Graham-like returns) | 1013% |
(Source: Portfolio Visualizer.)
How would you like to double your money in the next 1.5 years while collecting the highest yield in Verizon’s history?
It’s The Best Time In History To Buy 7.5% Yielding Verizon
I am not a market timer, and by the best time in history to buy Verizon, I mean the highest yield it’s ever offered.
A yield that’s backed up by recession-resistant and growing free cash flow.
A yield supported by a strong BBB+ credit rating and rock-steady fundamental risk according to the bond market.
A yield supported by a management team that is so dividend-friendly, Verizon hasn’t missed a dividend payment in 39 years. And its dividend growth streak is 16 years.
What about the coming recession? If I wanted to own Verizon, I wouldn’t wait or fear or expect significant declines from here.
Verizon During Every Bear Market Since 1985
| Bear Market | VZ | 60/40 | S&P |
| 2022 Stagflation | -20% | -21% | -28% |
| Pandemic Crash | -12% | -13% | -34% |
| 2018 | 7% | -9% | -21% |
| 2011 | -1% | -16% | -22% |
| Great Recession | -34% | -44% | -58% |
| Tech Crash | -52% | -22% | -50% |
| July 1998 to October 1998 | -3% | -10% | -22% |
| 1990 Recession (May To October) | 3% | NA | -20% |
| 1987 Black Monday Period | -15% | NA | -36% |
| Average | -14% | -19% | -32% |
| Median | -12% | -16% | -28% |
(Sources: Portfolio Visualizer Premium, Charlie Bilello.)
Verizon is a great defensive choice if you’re worried about the 30% base-case correction that’s historically coming within a year.
Its average bear market peak decline of 14% is 56% less than the S&P and 40% less than a 60/40.
So you see, my friends, just because the market is being silly, stupid, and in some cases, insane, doesn’t mean that you have to sell everything and join Robert Kiyosaki in his doomsday bunker. 😉
Blue-chip bargains are all around us. In the case of Verizon, it’s the best time in history to buy this 7.5% yielding anti-bubble blue-chip bargain.
I own $9,000 worth of VZ via SCHD.
Read the full article here

