
Intro
We wrote about Vuzix Corporation (NASDAQ:VUZI) back in April of this year when we stated that the market demanded higher top-line growth rates from the firm to price shares higher over time. We stamped a ‘Hold’ rating on the stock at the time which was the right call as shares are more or less flat over the past 20 weeks or so. Nevertheless, although top-line growth rates have been accelerating (28% Trailing 12-month growth as opposed to the company’s 23% 5-year average), the market continues to demand even more, essentially to justify the stock’s very steep valuation as well as the sustained negative earnings print.
When we drill down to Vuzix’s numbers in the company’s most recent second quarter, we see that sales grew by an impressive 56% on the back of strong M400 product sales. GAAP earnings however came in at -$9 million which was only a +$1 million improvement over the same period of 12 months prior. Profitability from a cash-flow perspective also was not impressive in the second quarter with operating cash-flow of -$7.9 million coming in as the worst quarter since Q4 in fiscal 2021.
On a bright note, where the company has improved over the past 5 months or so has been its valuation, specifically, the company’s forward sales multiple. Back in April, consensus was expecting just over $17.6 million in annual sales whereas the top-line estimate now comes in at $18.61 million for fiscal 2023. As a result, Vuzix’s fiscal 2023 sales multiple now comes in at 12.56, and 40%+ top-line expected growth in fiscal 2024 means a fiscal 2024 price-to-sales ratio of 8.66. Momentum one would think?
Suffice it to say, when one couples those decreasing sales multiples with the huge potential of Vuzix’s technology in the likes of AI, waveguides & the smart glasses industry as a whole, one may be tempted to start scaling into the stock on the long side. At this juncture though is where technical analysis becomes crucial as share-price action can give us insights on when to time a potential investment or not. We will start with Vuzix’s intermediate chart to see how the market (investors) have been taking to this recent strong top-line sales growth.
Intermediate 5-Year Chart
There are several trends on Vuzix’s intermediate 5-year chart that are worrying, to say the least. Given that we have seen lower lows for the best part of 30 months now, trend-following indicators end up usually being the most reliable tools when trying to ascertain future share-price direction. The reason is that established trends shares must remain the main tend to persist as they are based on human sentiment or psychology which in the main does not change. Therefore, with Vuzix’s 10-week moving average ($4.48) moving precariously close to dropping beneath its corresponding 40-week counterpart ($4.43), the risk here is that sustained downward pressure will appear once more as it did in mid-2021 & 2022 as we see below.
The other issue we see on Vuzik’s intermediate chart is the fact that shares are trading right at support which has lasted now for almost 9 months. If we break through this support level (an elevated selling day would be the tell-tell sign), this support would then become overhead resistance for the stock. Therefore, it is imperative that shares remain above support here to ensure the short-interest ratio (20%+) does not go even higher over time.
VUZI Intermediate 5-Year Technicals (Stockcharts.com)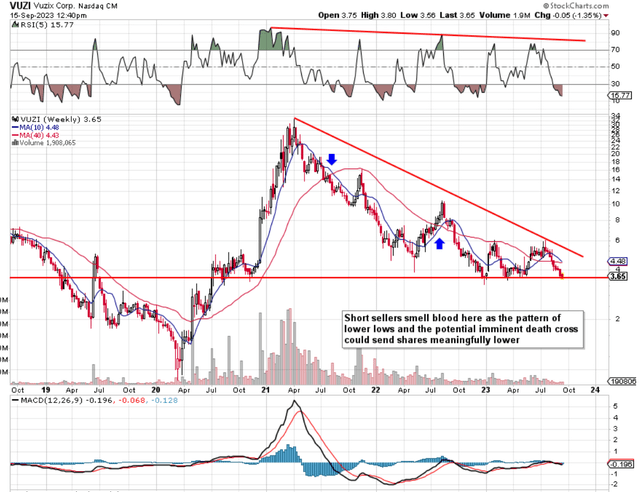
12-Month Daily Chart
On the daily chart, as we see below, the present price of Vuzix of approximately $3.60 a share means the April lows this year have held so far (support). When we zone in the company’s volume trends, however, we see a different story. As we see below, Vuzix’s OBV (On Balance Volume) is much lower now than it was back in April. The ramifications of this difference between Vuzix’s price and volume are the following.
As technicians, we believe that volume trends precede share-price action so the ‘odds’ would state that shares of VUZI will continue to go lower here over the near term until volume trends can turn more bullish.
VUZI 12-Month Technicals (Stockcharts.com)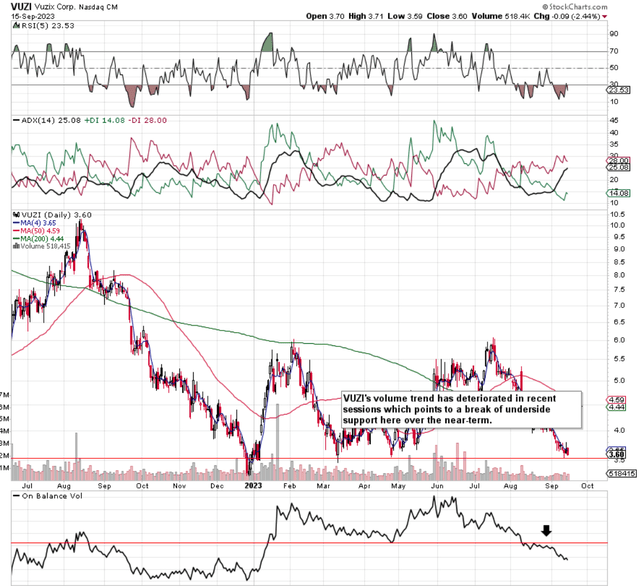
Conclusion
Therefore to sum up, although VUZI posted 56% top-line growth in its second quarter, the market remains unimpressed as all we have seen since the announcement in early August is the continued pattern of lower lows. Next week’s trading in this stock will tell us a lot. We look forward to continued coverage.
Read the full article here

