Bonds for safety and equity for growth – this is the basic formula for long-term investment planning, the essence of portfolio construction around a client’s specific return objectives and risk tolerance.
With that formula in mind, take a look at the chart below. Without looking at the labels, which one of the two price performance lines would you think represents a common stock index, and which depicts the yield for 10-year Treasury securities?
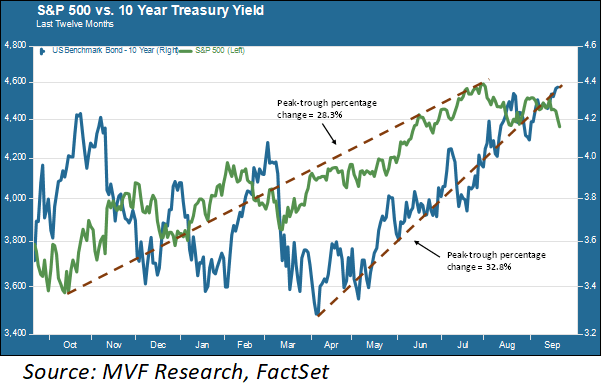
You would intuitively think that the line that moves with less up-and-down variance would be the one representing the safer asset – the one used as a proxy for the “risk-free asset” of financial valuation theory. Not here, though.
The blue line shows us how the 10-year Treasury yield has moved from day to day over the last twelve months, which period includes a percentage change of 32.8 percent from its low point back in March to the high (thus far) reached yesterday (Sep 22).
By contrast, the change for the S&P 500 stock index, in green, is just 28.3 percent from last October’s low to this year’s high point reached in July.
You can also see more pronounced short-term volatility swings in the Treasury yield than in the stock price index – in fact, the average daily percentage change in the Treasury yield is almost twice the average percentage gain or loss in stock prices (1.54 percent to 0.79 percent).
The Price of Money
Admittedly, we don’t intuitively think about bond yields in the same way we do about stock prices. If the yield on the 10-year Treasury note goes from, say, 4.245 percent to 4.33 percent – well, nobody’s going to breathlessly report that on the CNBC daily market wrap-up.
In terms of a percentage movement, though, that change from 4.245 to 4.33 represents a magnitude of two percent (4.25 x 1.02 = 4.33). If, on the other hand, the Dow Jones Industrial Average goes up or down by two percent on a given day, that’s a newsmaker.
It’s a gain or loss of around 690 points at current Dow levels – hundreds of points! Here is one of those behavioral traps of which the financial world has plenty.
Since bond yields are already expressed as percentages, it’s hard for the brain to do the math to accurately express a change in yields in percentage terms, whereas it’s easy for the brain to register “690 points” as a big deal (which is a major reason why financial news reporters love to report on the doings of the Dow).
But a bond yield is also a price – it’s the price of money, a market price agreed to between buyers and sellers of credit. And US Treasury securities are arguably the world’s most important publicly traded asset.
So it’s worth paying attention to those movements in Treasury yields and asking why they go up and down as much as they have been in the last year.
Getting It Wrong, All Year Long
One reason why yields on the so-called risk-free asset have been bouncing around so much this year is that the bond market spent much of the first half of the year adamantly refusing to believe that the Fed was going to keep interest rates higher for longer – even though Jay Powell and his colleagues literally said “higher for longer” every time the subject came up in their interactions with the public.
Back in early March, when the collapse of Silicon Valley Bank and a couple of other financial institutions raised fears of a general banking crisis, bond traders bid Treasury yields way down as expectations rose that the Fed would actually start immediately cutting – yes, cutting – interest rates.
Those sub-3.4 percent yields you see on the 10-year note in the above chart reflected a consensus pricing in of at least two rate cuts in 2023.
Well, it’s almost October 2023, and the only thing that has happened since March has been more rate increases and – if the Federal Open Market Committee is to be believed from its Summary Economic Projections reached this week – one more to come at either the November or December FOMC meeting.
The collective wisdom of the market simply got it wrong, and kept getting it wrong, for a good part of this year. Many of those sharp spikes in the 10-year yield you see in the above chart coincide with the dates of FOMC meetings.
Reporters at the post-meeting press conference would try to goad Powell into saying something about rate cuts, Powell would push back hard and say “higher for longer,” yields would shoot up and then fall back down again as bond traders talked themselves back into believing that there really was a rate cut pony out back.
It’s taken a while, but it seems that this past week’s FOMC meeting may have finally cemented the message into the bond market’s collective head. Perhaps there will be fewer of those wild stock market-like swings up and down going forward.
The good news to be found here is that, with the economy’s performance so far this year exceeding the expectations of most economists, including those of Powell and his Fed colleagues, the danger of “higher for longer” triggering a recession is substantially lower than it was earlier in the year.
If the Fed can actually pull off a soft landing while bringing inflation back to target levels, that should be a net positive for asset markets in general. Which would be nice, because there will be plenty of other challenges to deal with in 2024.
Original Post
Editor’s Note: The summary bullets for this article were chosen by Seeking Alpha editors.
Read the full article here

